
Business Diner Tools:


For Restaurants
Business Dining in the Big City: a Return to Pre-Pandemic Patterns
Throughout our State of Business Dining analysis since 2020, one trend we’ve followed closely has been the geographic distribution of business dining in major markets. As corporations shuttered their headquarters during COVID — many located in major cities — the shift in business dining spend from big cities to suburban areas was striking.
Before the pandemic and the normalization of remote work, most business dining occurred in big-city restaurants near company headquarters. As COVID restrictions eased, business dining spend (measured by the BDIndex) gradually increased. But with many business diners working from home offices, they chose meeting locations closer to home, like coffee shops, restaurants, and bars.
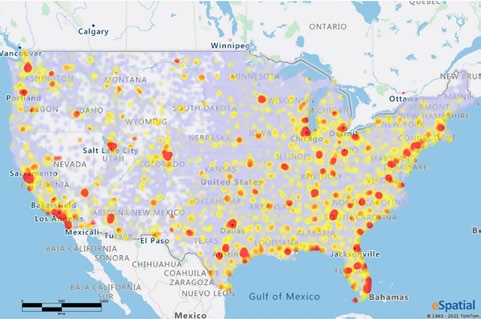
Pre-Pandemic Business Spend
Early Business Dining Recovery
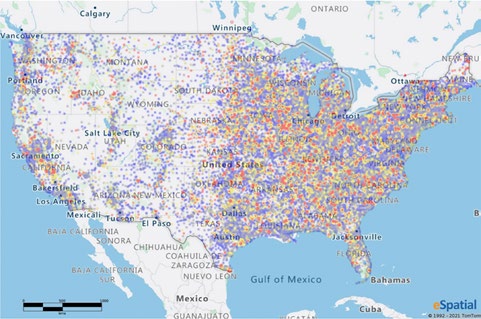
Business Dining recovery as reported in the Q2 2022 report. As many people continued working remotely, business dining spending became more distributed and less limited to major metropolitan areas.
By Q1 2023, signs of a new normal were emerging. Among them: business dining spend returned to city centers in some major metros. While the trend was most pronounced in New York City, Chicago, and Atlanta, we expect to see it replicated across other regions in the U.S. To understand how that could unfold in the coming months, let’s dig into the business dining data in each market from 2019 to 2022.
New York City
Businesses and restaurants in New York City were subject to some of the strictest COVID restrictions in the country. Business dining practically stopped when the pandemic struck; the Q2 2020 BDIndex was just 5 (or 5% of what it was during the same quarter in 2019). New York’s BDIndex dropped lower than any major city.
New York also saw one of the most dramatic business dining recoveries of any market. By the end of 2022, although its BDIndex still hovered around 50, spend was ten times what it was at the lowest point.
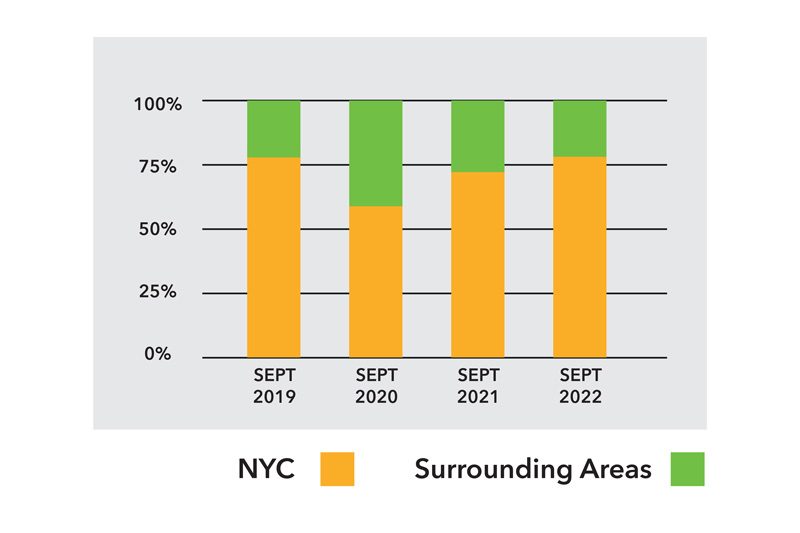
and surrounding areas, 2019 – 2022.
From September 2019 to 2022, New York City also saw dramatic shifts in where business people were dining. Before COVID, more than 75% of business dining happened within New York City’s five boroughs. In 2020, business dining spend doubled in surrounding areas. The suburbs with the most business dining activity were Bergen County, NJ; Long Island, NY; and Westchester County, NY.
As the city emerged from COVID’s shadow (with municipal employees ordered back to the office in early 2021), geographic patterns gradually returned. By September 2022, 78% of business dining occurred in the boroughs.
Chicago
The Windy City also tops the list for “most dramatic post-COVID business dining recovery.” In Q2 2020, Chicago’s BDIndex was in the bottom half of the 10 markets we analyzed; by Q4 2022, with a projected BDIndex of 72, it was one of the top markets for business dining recovery (tied with Las Vegas).
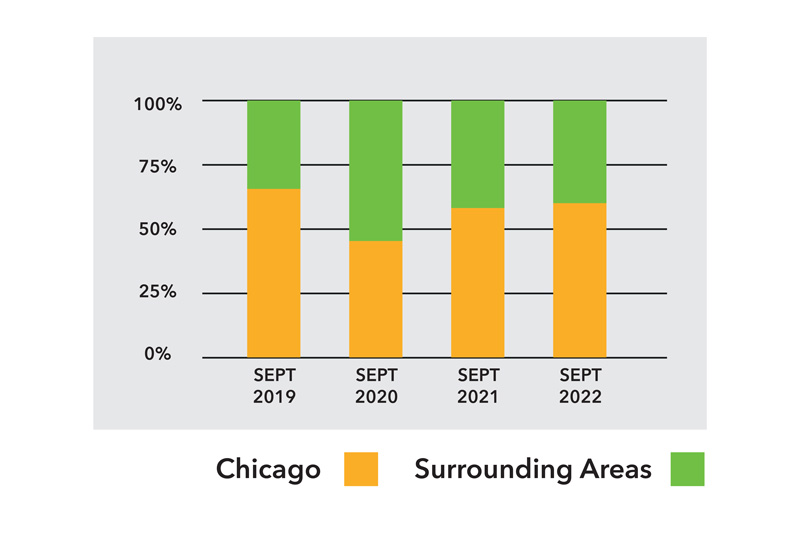
and surrounding areas, 2019 – 2022.
But to many downtown Chicago restaurants, recovery has felt “agonizingly slow.” That’s partly because, like in New York, business dining was more geographically dispersed after COVID hit. In 2019, 35% of business diners in Chicago were already choosing restaurants outside the downtown area. In 2020, the majority (51%) was happening in suburbs like Des Plaines, Naperville, and Schaumburg (the top three for business dining spend).
Unlike New York, business dining spend in downtown Chicago hasn’t surpassed 2019 numbers — but the data indicates a slow return to pre-pandemic patterns. Downtown’s share of business dining increased 22% in 2021; by 2022, distribution looked nearly identical to 2019.
Atlanta
Overall, business dining recovery in the city of Atlanta has been less dramatic than in New York and Chicago. This region actually proved most resilient in the early days of the pandemic with a BDIndex of 16 — the highest of the 10 markets — in Q2 2020. But restaurants, especially in downtown areas near big corporate headquarters, took a huge hit.
In September 2019, more than 70% of Atlanta business dining occurred in downtown Atlanta ZIP codes. A year later, that number was 50%. Restaurants in surrounding areas like Alpharetta, Marietta, and Duluth saw a business dining boost.
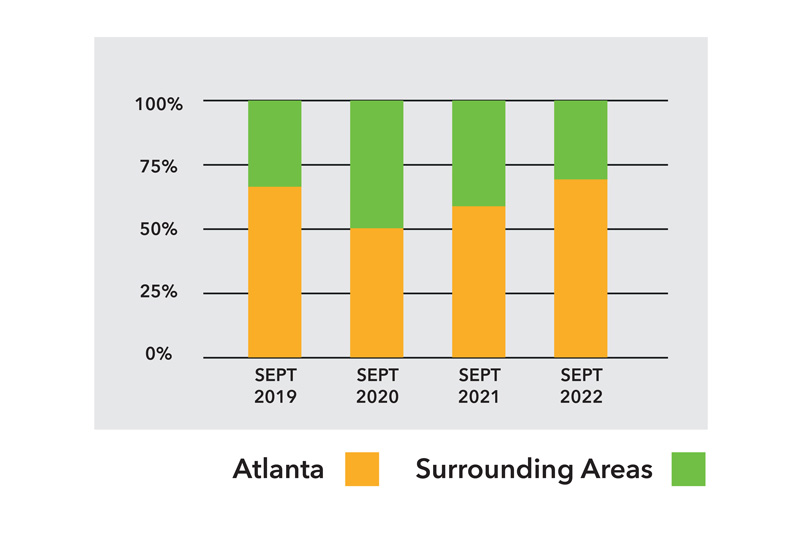
and surrounding areas, 2019 – 2022.
As workers resumed their commutes downtown, Atlanta’s BDIndex gradually climbed to around 64 (according to the latest data projections). Though many continued working remotely at least some of the time, they increasingly chose to dine during in-person workdays at restaurants near their offices. By September 2022, geographical spend distribution looked nearly identical to the same time in 2019.
Other Trends Impacting Business Dining
Geographical distribution is only one piece of the puzzle; there are other signs of normalcy in the data. Among them: a return to the seasonal business dining patterns which were consistent before the pandemic. In-person business meetings and conferences are also surging once again, which is great news for restaurants (particularly private dining and catering).
We’re also keeping an eye on emerging trends that could impact corporate travel budgets and where business people choose to dine. For a deeper dive, download the Q1 2023 State of Business Dining Report.
Q1 | 2023
State of Business Dining Report
Want more exclusive business dining insights? Download our free State of Business Dining Report.