
Business Diner Tools:


Industry Reports
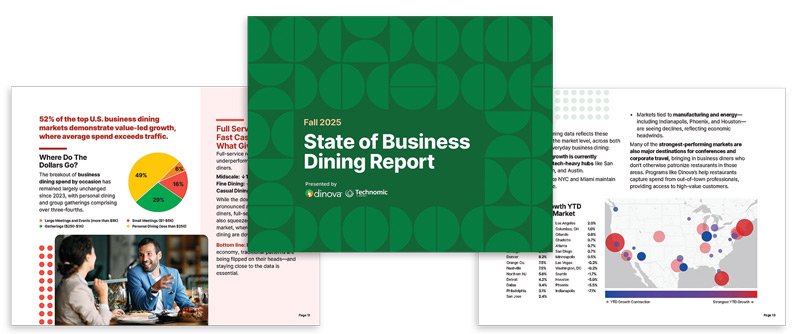
Fall 2025 State of Business Dining Report
One in Five Restaurant Dollars Comes from Business Dining—Here’s What That Means for Your Bottom Line
The headlines focus on consumer pullbacks. But there’s a bigger story: business dining represents $170-212 billion annually, nearly 20% of all U.S. restaurant spend. And it’s growing faster than the overall market.
This free restaurant industry report reveals which restaurant formats, metro areas, and strategies are winning with corporate diners right now and what you need to do to capture your share.
What You’ll Discover Inside the Report
- The True Size of the Business Dining Market – For the first time, we’ve quantified the full scale of business dining: up to $212 billion, or roughly one in five dollars spent at U.S. restaurants.
- Restaurant Industry Outlook: Why Fast Casual Is Winning – Fast casual brands saw 5% YTD (Jan-June) growth among business diners. See how catering is fueling this momentum.
- Metro-by-Metro Performance Analysis – Tech hubs like San Francisco and Boston post double-digit gains, while other markets face headwinds. Find out where your locations stand.
- Industry Spending Patterns Across 9 Sectors – Finance, tech, and telecom are increasing spend by up to 10%, while manufacturing and energy pull back. Learn which corporate clients to target.
- Catering Growth Opportunities – Actionable insights on catering trends, check sizes, traffic patterns, and spending behaviors shaping the rest of 2025.
- Key Takeaways for Restaurant Operators – Practical recommendations for positioning your brand to capture more business dining dollars in today’s market.
Why This Restaurant Market Trends Report Matters Now
Consumer traffic remains sluggish. Inflation concerns persist. But business dining is holding steady and, in many segments, thriving.
The restaurants that understand these foodservice industry trends will gain a competitive edge. This report gives you the data to make smarter decisions about where to focus your efforts, which formats to prioritize, and how to position your brand for corporate diners
Who Should Read This Report
- Restaurant Operators & Executives – Understand which formats and markets are capturing business dining dollars and how to position your brand for growth.
- Corporate Travel & Procurement Professionals – Get visibility into dining spend patterns, budget trends, and how your company’s spending compares to industry benchmarks.
- Foodservice Industry Analysts – Access comprehensive data on a market segment that represents up to 20% of U.S. restaurant sales.
Methodology
This analysis combines data from four key sources: U.S. Census Bureau restaurant spending data, Global Business Travel Association (GBTA) corporate dining insights, Technomic restaurant brand data, and proprietary Dinova transaction data.
The study covers 2023-2025, using 2023 as the baseline year for growth comparisons. Our sample includes 27 major metropolitan markets, 500+ companies across nine industry sectors, and millions of business dining transactions. Restaurant brand analysis aligns with Technomic’s top 300 restaurant brands for comprehensive market coverage.
Business Dining Market Size Calculation
Dinova’s market size estimate is based on a blend of top-down and bottom-up analysis, drawing from U.S. Census industry totals, GBTA business travel data, IRS filings, and our own corporate cardholder spend data. Because no single source captures all business dining activity and reporting practices vary widely, the result is a range rather than a single figure: $170-212 billion, or roughly 16-20% of the U.S. dining market.
About the Authors: Dinova & Technomic
Dinova is the business dining solution that delivers spend visibility and savings for companies while also driving growth for restaurants. Our Preferred Dining Program connects over 24,000 restaurants across the U.S. and Canada with nearly 600 corporations, government agencies, and small to medium-sized businesses.
Technomic has delivered unparalleled understanding and information to the foodservice industry since 1996, supporting thousands of professionals worldwide with original research across every facet of the industry.

Fall 2025 RELEASE
Get Your Report
Complete the form and you’ll be taken to the latest State of Business Dining Report.