Business Diner Tools:



Dining Reports
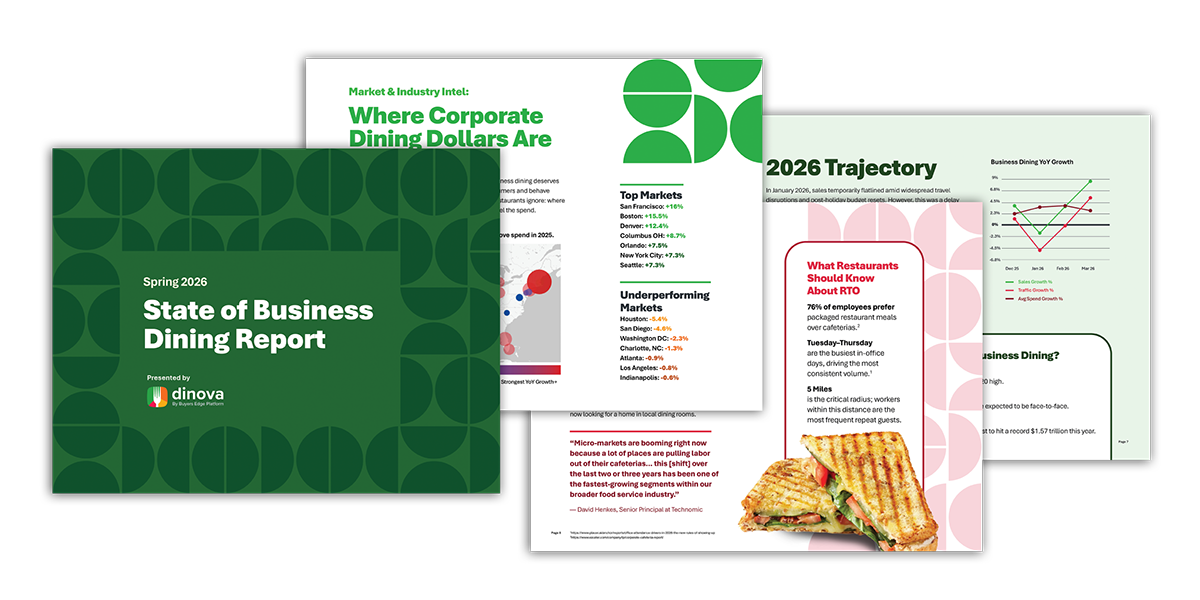
Spring 2026 State of Business Dining Report
Corporate Dining Spend Hits $250 Billion as Consumer Fatigue Widens the Gap
As economic pressures cause consumers to rethink every restaurant visit, business dining tells a different story. With an estimated $250 billion in annual spend, business dining has established itself as a crucial growth engine in a two-track economy.
This free report draws on proprietary data from millions of corporate cardholders to show where business dining is growing and what restaurants can do right now to capture more of this spend.
What You’ll Discover Inside the Report
- Business dining is a $250 billion market – nearly 23% of all U.S. restaurant spend. Most restaurants aren’t actively competing for it.
- Consumer foot traffic is flat. Business dining isn’t. See how the two markets diverged in 2025 and what’s driving growth into 2026.
Plus, see which cities and industries are gaining momentum, how companies are rethinking the way they feed their employees, and practical steps restaurants can take to capture more of this spend.
Why This Report Matters Now
Consumer foot traffic is flat, and walk-in growth is hard to come by. But business dining remains resilient, and restaurants that understand this market will be better positioned to protect their margins.
This report gives you real data to act on, whether you’re near a corporate hub, in a secondary market, or just looking for a smarter way to fill the dining room midweek.
Who Should Read This Report
- Restaurant Operators & Executives – Understand which formats and markets are capturing business dining dollars and how to position your brand for growth.
- Corporate Travel & Procurement Professionals – Get visibility into dining spend patterns, budget trends, and how your company’s spending compares to industry benchmarks.
- Foodservice Industry Analysts – Access comprehensive data on a market segment that represents +20% of U.S. restaurant sales.
Methodology
Dinova’s proprietary data covers 27 major metropolitan markets, 500+ companies across nine industry sectors, and millions of business dining transactions. Market sizing draws from IRS meal expense benchmarks, IMF GDP data, and BEA industry proportions. Restaurant brand analysis aligns with Technomic’s top 300 brands.
We would like to acknowledge Technomic for their contributions to the consumer research and data informing this report.
About Dinova
Dinova connects 24K+ restaurants across the U.S. and Canada with 600 corporations, government agencies, and small to medium-sized businesses. In 2025, we joined the Buyers Edge Platform family, bringing deeper data intelligence and expanded resources to our restaurant and corporate partners.
New release | SPRING 2026
Get Your Report
Complete the form, and you’ll be taken to the download page.